Gimp tutorial: how to use curves for advanced exposure correction
An explaination on how to read and use Gimp's curves tool: in this tutorial we will learn the most advanced tool to change the exposure of your photos.

Curves tool, in my opinion, is the most powerful and helpful tool that Gimp offers. Knowing how to setup a curve should be a mandatory skill for anyone who wants to edit a photo. I'm not exagerating, it's a game changer tool. This tutorial has been created to explain to all those who approach graphics and photography how to correct the exposure and contrast of an image using the Gimp's Curves tool . This guide is valid for any photo editing program and RAW image processing software, as the curves work in the same way in any different program, however for these examples has been used Gimp.
To fully understand this tutorial you need to know how to read the histogram and how to adjust the color levels
of a photo. If you are not sure to know what we are talking about, we recommend to read this tutorial before proceeding.
Color curves adjustment, however, have a huge advantage in exposure correction compared to color levels: curves allow us to raise the contrast without going to burn out the high or low lights.
Let's see an example.
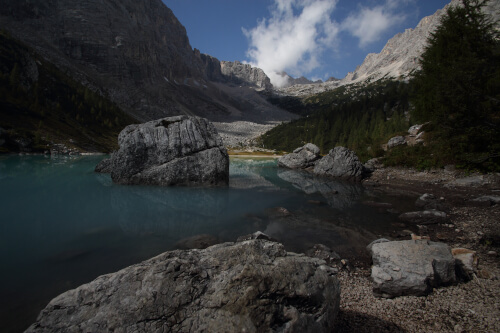
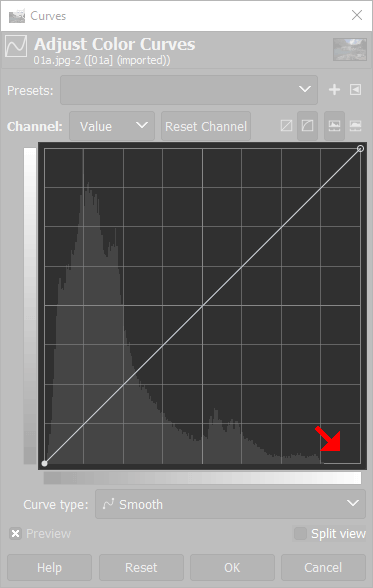
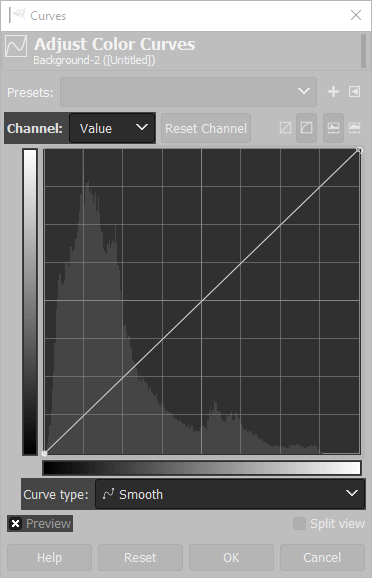
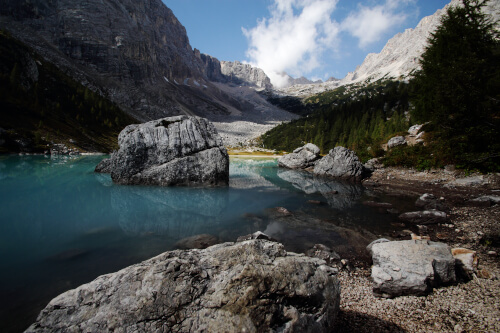
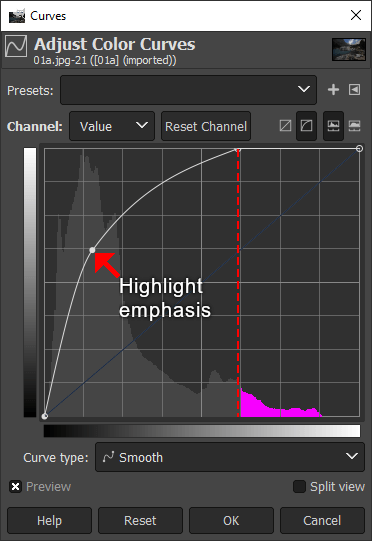
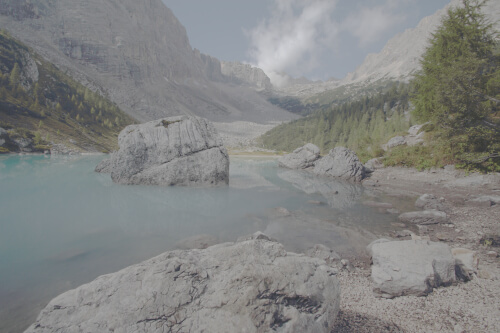
As first image, we will use a dark photo with a strong lack in the highlights (highlighted with the red arrow). To get started we use the default parameters of the curves tool,
it can in fact be noted that the curve is actually a perfectly straight white line.
Why are curves the best method?
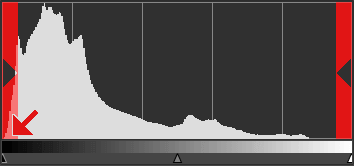
If we want to increase the contrast of a photograph there are different ways to proceed: the first, the simplest of all, is to increase the contrast. Just open Colors → Brightness-Contrast and increase the value of the contrast as you prefer. A more detailed explanation is available in this basic tutorial. In this way, by adjusting a simple slider, we can easily increase the contrast "tightening" the histogram in a super easy and automatic way. The result is graphically represented by the image below, where we are "deleting" the red bars. It cause two problems:
- The first is that we are going to eliminate a part of the detail of the dark tones, as highlighted by the red arrow on the left in the image below, with consequent burn out of some shadows
- The second is that, using only the contrast slider, we are very limited. In fact, we cannot work on the medium tones of the photograph, since the contrast acts only at the edges of the histogram
Another way to proceed is to manually adjust the color levels on the histogram, as explained in this tutorial. This allows us to have more control, we can also modify the middle tones, but it remains a solution limited by the fact that we can only work on three parameters. For example, if we want to increase the contrast and lighten the shadows, without however changing the values of the mid tones and without burning out the high lights, it would be impossible. These are the cases where curves becomes the best tool.
Some examples of curves
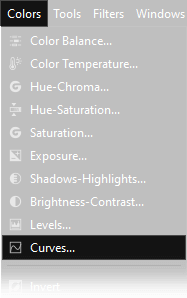
Let's open the Gimp curves tool, by going to Colors → Curves. The window that will open, will be very similar to the one you see below, with a light gray histogram on the background and the two bars left and down, that remind us that the shadows are on the left and bottom, while the highlights on the right and top. At the top there is a dropdown menu, called channel with the parameter Value selected, we will always and only work on this channel, but if you prefer a most advanced personalization, it is possible individually correct the curves of red, green and blue channels, for example to fix the dominant colors. Below we should always remember to leave the curve type as Smooth and leave the Preview Box checked, to see the result of the changes in real time.
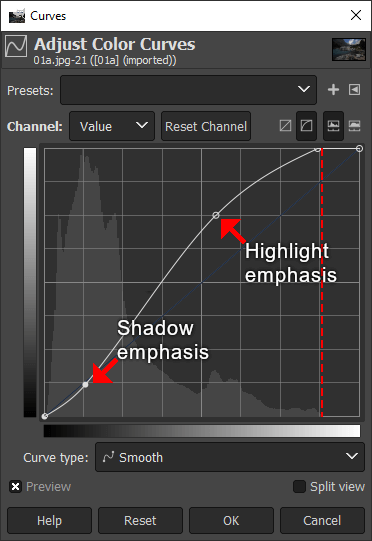
Now let's try to correct the brightness and contrast of our photograph using the Gimp curves. Later I'll do some other examples and finally I'll explain better how the curves act on the different areas of the image and histogram. First of all, let's start with some practical examples: the photo is rather underexposed, therefore we need to increase the highlights, eliminating the empty histogram part on the right. This empty space is marked with a red dotted line on the image just below.
The first thing to do is to click the point at the top right of the curve with the left mouse button and move it to the left, until the first vertical lines begin to form on the background histogram, the same spot marked by the red dotted line before.
Then we have to move the mouse cursor on any point of the white line, click with the left button
and move the cursor upwards, always holding the left mouse button. We'll got three things: We added a checkpoint,
we got a curve and we have lightened the image. This is because we have created an upward curve, and up is the direction in which the colors lighten.
Now we have to do the same thing on the left side of the curve, but moving the cursor slightly downwards. This isbecasue we have to
make the dark tones of the image return to the initial conditions (in reality they are just slightly darker than before).
As you can see the previously underexposed areas have brighten, both thanks to the creation of the point "Emphasis on highlights",
than for having move the origin of the curve to the left, up to where the dotted line is. The shadows were instead preserved, thanks to the point
"Shadow emphasis". The increase in contrast is given by the curve that takes on an S shape: in this way the shadows are darkened, lowering
the left part of the curve and the lights are brightened, raising the right part of the curve.
Let's go now to see some other examples of curves, which could be considered "wrong", but that could be useful in some particular case. Different examples also offer a different point of view, even if incorrect, so you can better understand how curves affect photography.
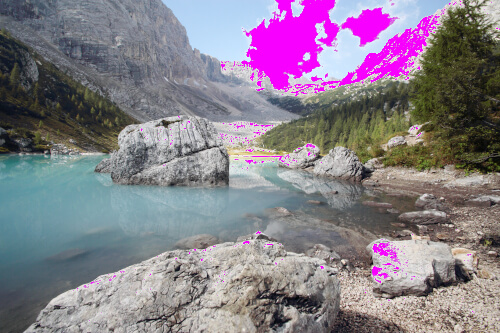
Curve with excessive light increase
In this case I applied a curve without lowering shadows, so avoiding the "S" shape, emphasizing only the highlights. I also set the point at the top right, where the curve ends, inside the histogram, resulting in burning out of all high lights (highlighted in fuchsia). As you can see, the photograph appears overexposed, but lacking in contrast. Shadows are still quite dark, as we have not acted on the point at the bottom left, but all the colors have become slightly contrasted and decidedly too light.
Curve with destruction of shadows and contrast
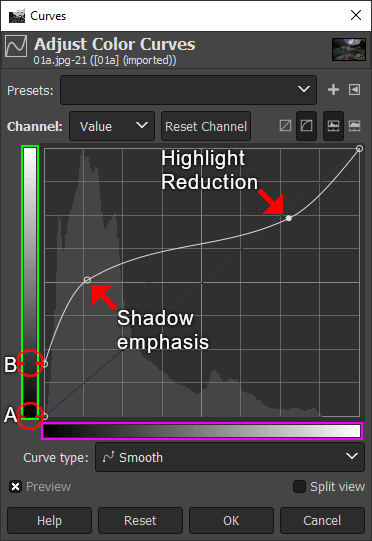
In the next example we are going to set an inverted S curve, with total destruction of the shadows and contrast. In this case it should be better
understandable how the two bands to the edge of the histogram can be used to understand how colors will be transformed.
First of all we have moved the origin of the curve up, from the point A to the point B, with this curve all pure blacks are transformed into grays.
The two bands have the purpose of making us understand how our curves will act on colors. The horizontal band (highlighted in purple) represents
the colors in the bar of the histogram: on the left there are the dark tones, on the right the light tones. The vertical band (highlighted in green) represents the
result that the colors will take after applying the curve. We will deepen this point in a very short time, after this last example.
Starting the curve from point B brighten the "full black", going up to the point Emphasis of the shadows will also lighten
a lot the dark tones. By lowering the Reduction of highlights point, we darken the light tones. We have created an inverted S,
opposite from the one of the first example, so all the dark tones have been lightened and the contrast is drastically reduced.
How curves work
Hoping that the first part with the practical examples has helped you, we will now do some theory to learn how to read the curve. We know that every
photograph has light and dark colors. As already explained in the color levels
tutorial, these colors are represented graphically with an histogram layed on an horizontal line.
When you use the Gimp's curves tool, you will notice a blue line at 45 ° that cross the whole histogram. That line represents the current state
of the brightness. By drawing a curve, you will move all the colors on a certain brightness up or down along the vertical bar, darkening or lightening it.
Ok, a little bit messy, it's easier with an example: let's take a look at the photo below, we have three points: A, B and C Let's see how they will behave changing the curve.
- Point A: it's on the left side, as you can see inside the red circle, the color is almost black. It measn that any modifications we will do at this point will affect only extremely dark colors. We have moved it down. If you look left you can see that there is a tiny green arrow. Colors becomes darker going down, so pratically we are darkening the dark tones of the image
- Point B: also this point represents dark colors, but lighter than before. It has been moved down, more than the point A, so it means that also medium dark tints will be darker
- Point C: it has been moved up, so it means that medium light tones will be brighter than before
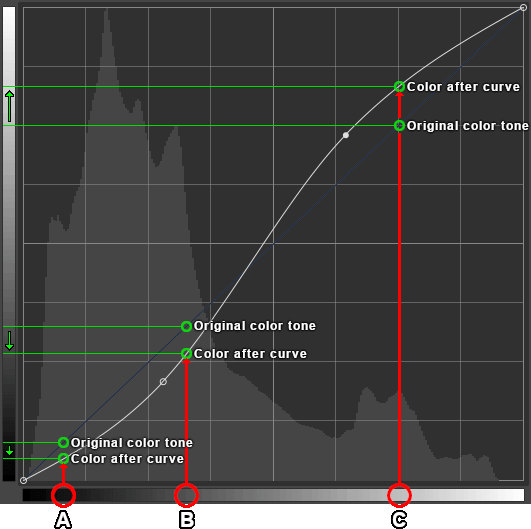
An important thing to say about this curve is that the origin of the curve and the medium point are absolutely the same. It means that we will not burn out neither bright colors nor black colors. Medium tones remains the same, so we are increasing the contrast without changing the exposure.
Save a curve preset
The last point I would like to tell you about is the ability to save the curve presets that we use most often. I personally believe this thing is practically useless, as the correction of the curves takes few seconds, so the time saving is really minimal. It is also practically impossible that one curve is perfectly adequate for two completely different photographs. In any case, you may have to elaborate a series of identical photographs, or maybe you could have other needs that I haven't thought of.
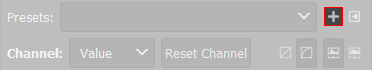
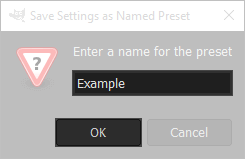
If you want to use this function, once you have set the correct curve, just press the "+" button located to the right of the Presets drop-down menu, after that you must Enter a name for the Presets and finally press OK. In the future you will find the saved curve in the Presets drop-down menu.
If you liked this tutorial here you can find all the guides we have written about gimp, from the simplest to the most advanced, or you can all the guides we have written about photography in general. If you liked our work, you could consider to ❤support us: by clicking here you can see how.