Gimp tutorial: Adjust color Levels (Histogram)
One of the most useful Gimp's tool is Color Levels: in this tutorial we will learn histogram modification and reading, to change the exposure of your photos.

Histogram is one tool that any photographer should know. This is a Gimp tutorial, but histogram exists also outside Gimp, and is extremely useful.
If you like photography, you should definitely know how to read a level histogram.
When you shoot a photo, is not easy to understand if the exposure is correct or not: the camera monitor is too tiny, and often is hard to read because of the sunlight. There is
only one way to check in a second if the exposure is acceptable: the histogram of the color levels. It appears as a graph, you can see an example down there,
which contains all the information of the light distribution in your photograph. Don't worry if you have not perfectly understand: we will explain the histagram concept
again and again, in a really easy way, in all this tutorial, both in a general context that specifically for using the color layers in Gimp.
Most camera have the option to show the histogram somewhere, so I suggest you to read your camera manual if you can't find it. Once activated, you will find yourself in front of a bar graph, in black and white, that will probably make no sense to you. I have to tell you that knowing how to read this fundamental tool will radically change the quality of your shots, and will allow you to understand in a second if the photo exposure is correct. Histogram of light levels is a tool that is extemely useful when used in realtime with manual settings.
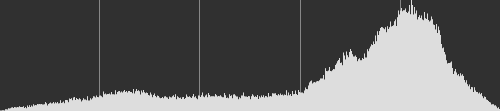
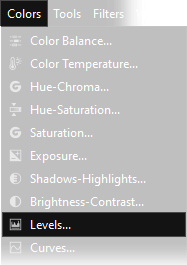
What you see below is a photograph with its histogram; If you opened a photograph with Gimp and you want to view the histogram of your image, just go to the menu Colors → Levels. Now the question is: how do you read this graph?
The histogram should be read "horizontally", dark colors are on the left, light colors are on the right. Vertical lines are used to understand how many pixels for a certain color are present in the image.
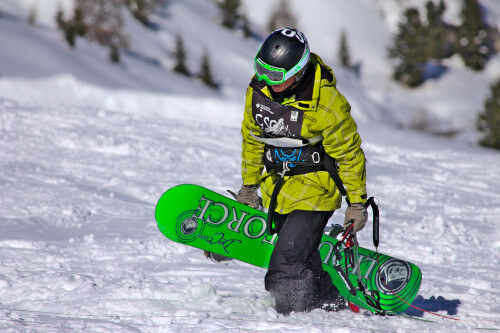
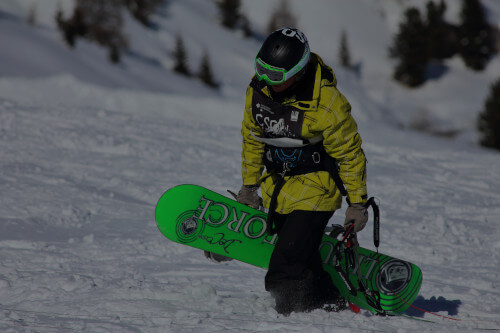
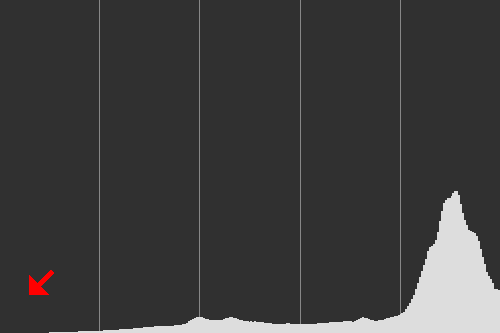
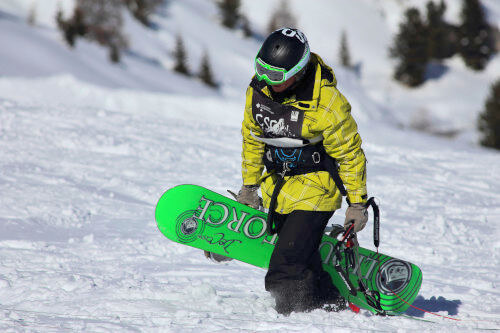
In the example above we have a photo with a relatively light background (the snow) and a subject with medium and dark tones (the snowboarder). In the histogram I've pointed the
dark areas with a blue arrow, medium tones with a green arrow and highlights with a red arrow.
As you can see the lines are concentrated mainly in the right part of the histogram, highlighted by the red arrow. This is because the background, that makes the most of the photo, is made up of very light colors.
The shadow areas are in the left part of the histogram and are quite low, as they are limited to the lapels of the jacket, to the harness and trousers.
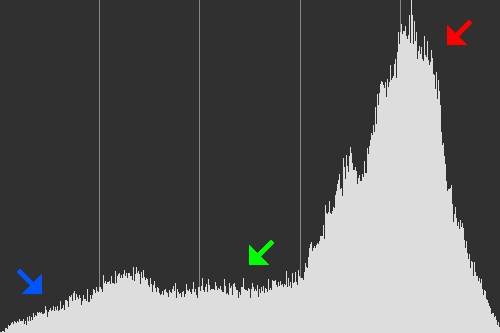
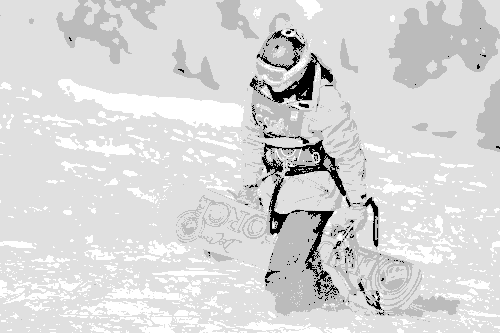
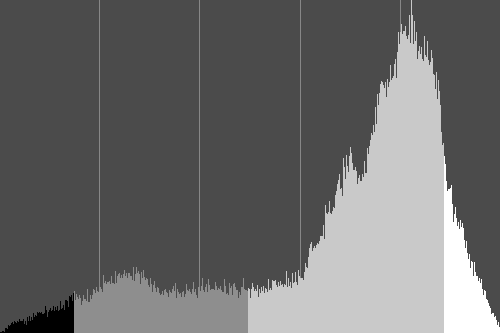
To simplify it even more, down there I've reduced the image to 4 colors and I've colored the histogram of the same color of the corresponding part of the photo.
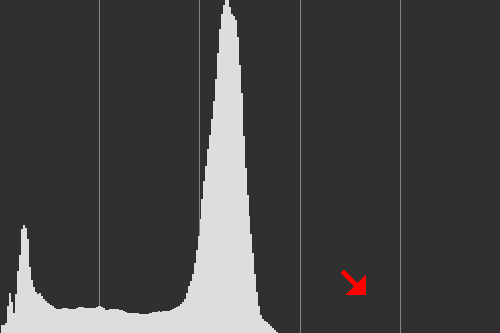
As you have seen in the example photo, exposure was correct, so the histogram occupied all the available space, but what happens if we try to process an underexposed photograph with little contrast? The high lights area, pointed with a red arrow, will be completely empty and the photograph will appear too dark.
And if we do the opposite? Let's try to edit an image with a very low contrast, and all the lights overexposed: the histogram will be clearly unbalanced in the opposite direction, with the shadows area completely empty and a shot clearly too bright.
Been able to read the histogram allows us to quickly understand if a photograph is correctly exposed, even if we are shooting under the sun, and the preview on the camera display would be hardly readable.
Another reason why the histogram is very useful is that it allows you to immediately identify if there are areas of the photograph, that are burned out, with a loss of information due to incorrect exposure.
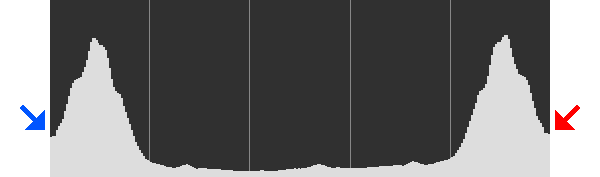
When photographing, in theory, the exposure should be adjusted so that no area is overexposed or underexposed, the histogram should always remain within the margins. When the lines
of the histogram continue beyond the visible area (as indicated by the red and blue arrow in the example image below) we have a clipping. It means that informations has been lost, and the shot could be compromised.
If there is a clipping on the left, we will have completely black shadows (blue arrow). If histogram is clipping on the right, we will have burned out lights (red arrow).
So when you read the histogram, for example during a photography session, you will have to ignore the height of the lines, and concentrate only on theyr extend in the horizontal space,
trying to fill as much space as possible, without getting too close to the edges. There is a theory on the internet that says that is better to expose on the right of the histogram, so you can get better
results in the digital processing phase. If you are interested in deepening the topic here
you can read our tutorial about ETTR: expose to the right.
In my humble opinion it is preferable to underexpose the photograph, because during
the processing of a Raw file it is easier to extract information from the dark areas rather than trying to recover a burnt light.
Use the histogram to correct the brightness
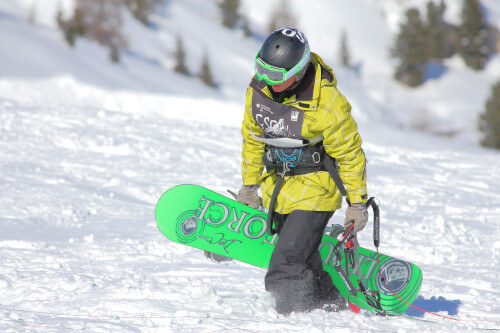
Now that the theory is explained, let's see how we can use the histogram to correct the exposure of our digital photographs in Gimp. Let's take as example the underexposed photo from above.
In Gimp, open Colors → Levels tool. Just below the histogram we can see three small arrows, one black, one gray and one white, we have to go to intervene on those. By clicking with the left mouse button we can move them to our liking, normally the aim is to eliminate all the empty areas of the histogram, as in the example image.
In our case the "empty" area is on the bright part of the photo (on the right), which is identified by the white arrow, highlighted by the red arrow. So we have to go drag her to the left.
As we move it we can see the corresponding number change, in our case we got to 141, highlighted in red.
The dark part of the photograph is correct, so we can leave the black arrow unchanged, at 0, highlighted in blue. Since the photo remained a little dark,
we also intervened on the central arrow, increasing the valuee to 1.25, highlighted in green, in order to lighten the image a little.
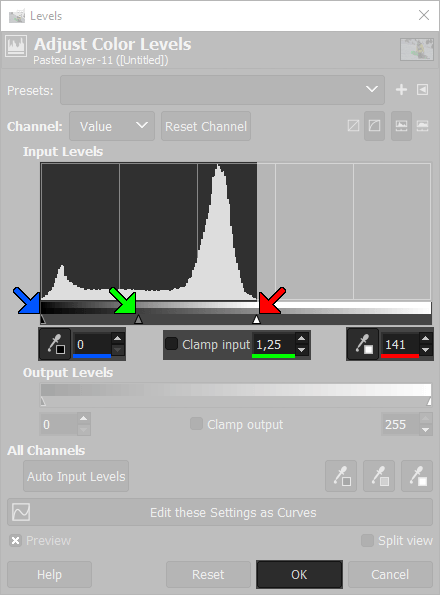
To explain in more detail what described above, the blue and red arrows indicate cursors (high and low input) which must be positioned to correspond to the beginning and the end of the histogram. In this way the limited histogram of the photograph is "tightened". As a result, we have a histogram that occupies all the available space, increasing the contrast of the photograph. The Gamma (central green arrow) refers to the brightness of the image as a whole, it is possible to move it to the right or left to lighten or darken the image, without going to burn out the high and low lights. Below we can see the result before and after the treatment.
The histogram is not only monochromatic, for the more advanced users it is possible to use the Channel menu to work individually on the green, red and blue channels to correct the color balance. This kind of elaboration is explained in another article, if you are interested I recommend you read the second part of the Gimp's white balance tutorial.
If you really want the best way to manage constrast of a picture, after you have checked the histogram, you should correct the gamma with curves, that are a really powerful tool, way better than the simple histogram. You can read the tutorial abouy histogram modification with curves here.
If you liked this tutorial here you can find all the guides we have written about gimp, from the simplest to the most advanced, or you can all the guides we have written about photography in general. If you liked our work, you could consider to ❤support us: by clicking here you can see how.